Advanced Energy Sales increase 58% year-over-year in Q4 and increase 73% year-over-year in FY’19
CLEARWATER, FL — MARCH 16, 2020 – Apyx™ Medical Corporation (NASDAQ:APYX) (the “Company”), a maker of medical devices and supplies and the developer of Helium Plasma Technology, marketed and sold as Renuvion® in the cosmetic surgery market and J-Plasma® in the hospital surgical market, today reported preliminary unaudited financial results for its fourth quarter and fiscal year ended December 31, 2019 and introduced financial expectations for the first quarter ending March 31, 2020.
The financial information contained herein are preliminary and unaudited and are subject to risks and uncertainties including changes in connection with quarter end and year end adjustments following completion of the annual audit. Any variation between the Company’s actual final audited results and the preliminary unaudited financial information set forth herein may be material.
The financial results presented for the periods ending December 31, 2019 and 2018 reflect the restatements and the revisions detailed in the Company’s non-reliance press release and reconciliation table, which were filed as an exhibit to Form 8-K on March 16, 2020.
Fiscal Year 2019 Financial Summary
- 2019 total revenue from continuing operations of approximately $28.2 million, up 69% year-over-year.
- Advanced Energy revenue of $22.6 million, up 73% year-over-year.
- OEM revenue of $5.6 million, up 54% year-over-year.
- 2019 total GAAP net loss from continuing operations of $19.7 million versus total GAAP loss from continuing operations of $10.8 million in 2018.
- 2019 total adjusted EBITDA loss from continuing operations of approximately $17.0 million versus adjusted EBITDA loss from continuing operations of approximately $12.3 million in 2018.
- The Company expects to report complete fourth quarter and full year 2019 financial results on its Form 10-K by March 31, 2020.
Fourth Quarter 2019 Financial Summary
- Total Q4 revenue from continuing operations of $8.4 million, up 41% year-over-year.
- Advanced Energy revenue of $6.9 million, up 58% year-over-year.
- OEM revenue of $1.5 million, down 4% year-over-year.
- Total Q4 GAAP net loss from continuing operations of $5.4 million versus total GAAP net loss from continuing operations of $3.9 million for the fourth quarter of 2018.
- Total Q4 adjusted EBITDA loss from continuing operations of $4.8 million versus adjusted EBITDA loss from continuing operations of $4.6 million for 2018.
Fourth Quarter 2019 Highlights
- On October 14, 2019, the Company announced that it had initiated subject enrollment in a U.S. Investigational Device Exemption clinical study evaluating the use of its Renuvion technology in skin laxity procedures in the neck and submental region.
- On October 14, 2019, the Company announced that it received U.S. Food and Drug Administration 510(k) clearance to market and sell the Apyx Plasma/RF Handpiece, a new addition to the Renuvion product family.
- On December 3, 2019, the Company announced that it had initiated subject enrollment in a U.S. Investigational Device Exemption clinical study evaluating the use of its Renuvion technology in dermal resurfacing procedures.
Management Comments
“We are excited to bring 2019 to a strong close, with revenue growth of 58% in our Advanced Energy business during the fourth quarter, which was fueled by high demand for our Helium Plasma Technology products from customers in the U.S. cosmetic surgery market as well as our international distributors,” said Charlie Goodwin, President and Chief Executive Officer. “In addition to our impressive fourth quarter sales performance, we were also pleased to announce the initiation of enrollment in two new clinical studies evaluating use of our Renuvion technology in dermal resurfacing procedures and skin laxity procedures during the fourth quarter, which represent important milestones in our journey to obtain new clinical indications for specific cosmetic surgery procedures.”
Mr. Goodwin continued: “In 2019, we achieved Advanced Energy revenue growth of 73% by successfully executing on our growth strategy to expand our share of the $1.5 billion market opportunity we are targeting in the U.S. and satisfy the increasing global demand for our technology. We are monitoring the crisis caused by the spread of the novel coronavirus (COVID-19) and are dedicated to protecting the health and safety of our employees, patients, surgeon customers and international distributor partners around the world. Given the challenges and uncertainties posed by the ongoing global pandemic, we will not be providing full year 2020 financial guidance at this time. In lieu of full year 2020 financial guidance, we are providing expectations for the first quarter of 2020. Assuming a more normalized business environment prevails at the time of our first quarter results conference call in May, we plan to provide updated expectations at that time. Importantly, with $58.8 million in cash on the balance sheet as of December 31, 2019, the Company is well positioned to fund our strategic growth initiatives for a number of years.”
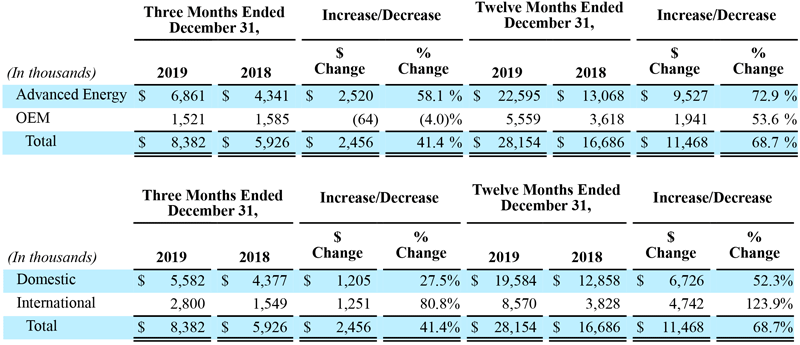
The following tables represent revenue from continuing operations by reportable segment (Unaudited) (Restated and Revised):
Fourth Quarter 2019 Results
Total revenue from continuing operations for the three months ended December 31, 2019, increased $2.5 million, or 41.4%, to $8.4 million, compared to $5.9 million in the prior year. Total revenue from continuing operations was driven by sales of the Company’s Advanced Energy generators and handpieces, offset slightly by a decline in OEM segment sales during the period. Advanced Energy segment sales increased approximately $2.5 million, or 58.1% year-over- year, to $6.9 million, compared to approximately $4.3 million last year, driven by contributions from the Company’s expanded sales force in the U.S. and new international distributors, compared to the prior year period. In both the U.S. and internationally, the Company experienced strong sales growth of its generators, coupled with utilization based demand for its handpieces. OEM segment sales decreased $0.1 million, or 4.0% year-over-year, to $1.5 million, compared to $1.6 million last year.
For the fourth quarter 2019, revenue from continuing operations in the United States increased $1.2 million, or 27.5% year-over-year, to $5.6 million, and international revenue from continuing operations increased $1.3 million, or 80.8% year-over-year, to $2.8 million. International sales growth in the fourth quarter was primarily driven by sales to international distributors in the Company’s Advanced Energy segment.
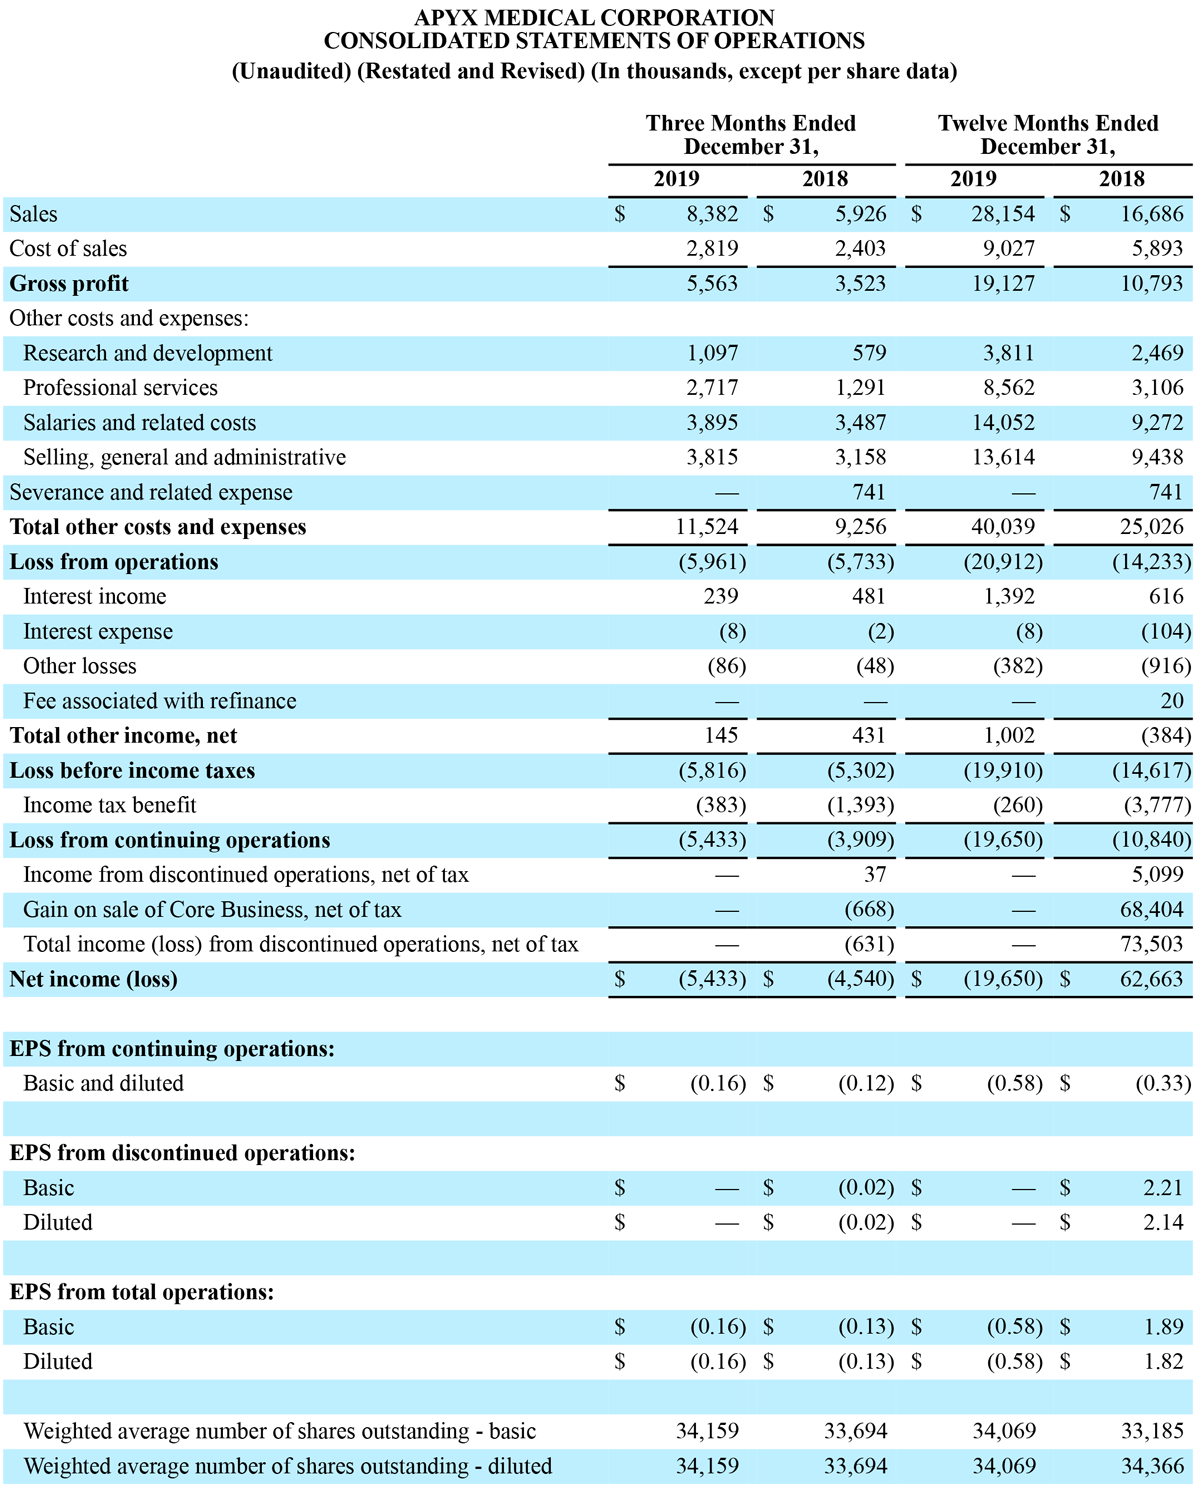
Gross profit for the three months ended December 31, 2019, increased approximately $2.0 million, or 57.9% year- over-year, to $5.6 million, compared to $3.5 million in the prior year. Gross margin for the three months ended December 31, 2019 was 66.4%, compared to 59.4% for the same period in the prior year. The primary drivers of the increase in gross profit margin were higher Advanced Energy sales as a percentage of total sales, as well as efficiencies realized in manufacturing processes in the fourth quarter of 2019. The year-over-year increase in gross margin was partially offset by a higher mix of Advanced Energy sales outside of the U.S. in the fourth quarter of 2019, compared to the prior year period.
Operating expenses from continuing operations for the fourth quarter of 2019 increased $2.3 million, or 24.5% year- over-year, to $11.5 million, compared to $9.3 million for the fourth quarter of 2018. The year-over-year change in operating expenses from continuing operations was primarily driven by a $1.4 million increase in professional services costs, a $0.7 million increase in selling, general, and administrative expenses, a $0.5 million increase in research and development expenses and a $0.4 million increase in salaries and related costs. Operating expenses from continuing operations for the fourth quarter of 2018 included severance and related expense of $0.7 million, related to the departure of the Company’s former Chief Financial Officer.
Net loss from continuing operations for fourth quarter of 2019 was $5.4 million, or $0.16 per diluted share, compared to a net loss from continuing operations of $3.9 million, or $0.12 per diluted share, for the fourth quarter of 2018. Total loss from discontinued operations, net of tax, was $0.6 million, or $0.02 per diluted share, in the fourth quarter of 2018. Net loss for the fourth quarter of 2019 was $5.4 million, or $0.16 per diluted share, compared to net loss of $4.5 million, or $0.13 per diluted share, for the fourth quarter of 2018.
Fiscal Year 2019 Results
Total revenue for the twelve months ended December 31, 2019 increased $11.5 million, or 68.7%, to $28.2 million, compared to $16.7 million in the twelve months ended December 31, 2018. Total revenue growth was driven by a 72.9% increase in Advance Energy sales and a 53.6% increase in OEM sales.
For the twelve months ended December 31, 2019, revenue in the United States increased $6.7 million, or 52.3% year- over-year, to $19.6 million, and international revenue from continuing operations increased approximately $4.7 million, or 123.9% year-over-year, to $8.6 million. International sales growth for the year was primarily driven by sales to international distributors in the Company’s Advanced Energy segment.
Net loss from continuing operations for the twelve months ended December 31, 2019 was $19.7 million, or $0.58 per diluted share, compared to net loss from continuing operations of $10.8 million, or $0.33 per diluted share, for the twelve months ended December 31, 2018. Total income from discontinued operations, net of tax, was $73.5 million, or $2.14 per diluted share, for the twelve months ended December 31, 2018. Net loss for the twelve months ended December 31, 2019 was $19.7 million, or $.58 per diluted share, compared to net income for the twelve months ended December 31, 2018 of $62.7 million, or $1.82 per diluted share.
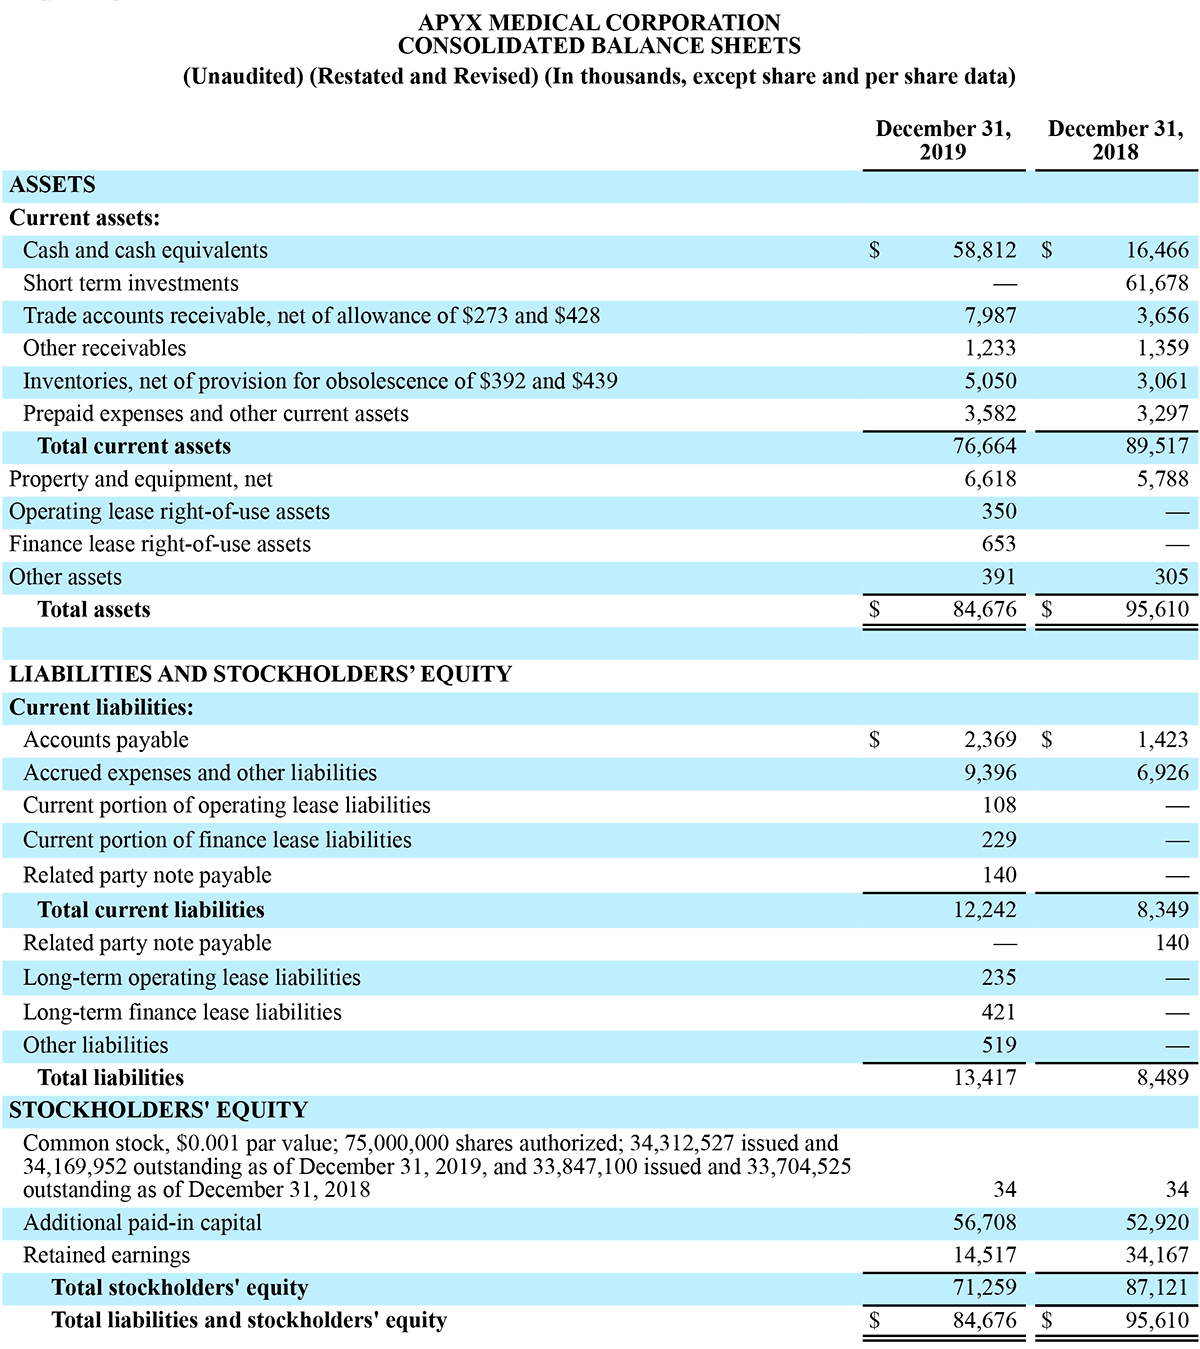
As of December 31, 2019, the Company had cash and equivalents of $58.8 million as compared to cash and equivalents of $16.5 million and short-term investments of $61.7 million as of December 31, 2018. The Company had working capital of $64.4 million as of December 31, 2019 as compared to $81.2 million as of December 31, 2018.
First Quarter of Fiscal Year 2020 Financial Outlook
The Company is introducing first quarter of fiscal year 2020 financial expectations for:
- Total revenue in the range of $5.0 million to $5.6 million, representing a decrease of 11% to 0% year-over- year, compared to total revenue of $5.6 million in first quarter of fiscal year 2019.
- Total revenue guidance assumes:
- Advanced Energy revenue in the range of $4.0 million to $4.6 million, representing a decrease of 8% to an increase of 6% year-over-year, compared to Advanced Energy revenue of $4.4 million in first quarter of fiscal year 2019.
- OEM revenue of approximately $1.0 million, representing a decrease of 21% year-over-year, compared to $1.3 million in the first quarter of fiscal year 2019.
- GAAP net loss in the range of $9.0 million to $8.6 million, compared to GAAP net loss of $5.6 million in first quarter of fiscal year 2019.
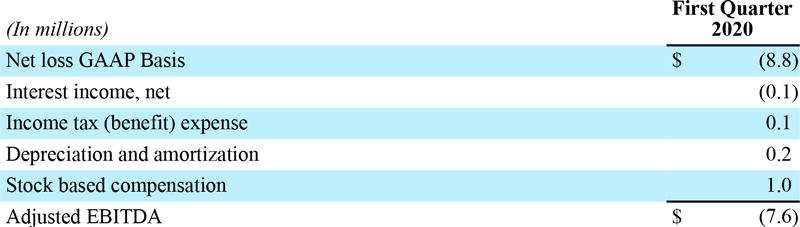
- Adjusted EBITDA loss in the range of $7.8 million to $7.4 million, compared to adjusted EBITDA loss of $4.7 million in first quarter of fiscal year 2019.
Conference Call Details
Management will host a conference call at 5:00 p.m. Eastern Time on March 16 to discuss the results of the quarter and to host a question and answer session. To listen to the call by phone, interested parties may dial 877-407-8289 (or 201-689-8341 for international callers) and provide access code 13698937. Participants should ask for the Apyx Medical Corporation Call. A live webcast of the call will be accessible via the Investor Relations section of the Company’s website and at:
https://78449.themediaframe.com/dataconf/productusers/apyx/mediaframe/35817/indexl.html
A telephonic replay will be available approximately two hours after the end of the call through March 30, 2020. The replay can be accessed by dialing 877-660-6853 for U.S. callers or 201-612-7415 for international callers and using the replay access code: 13698937. The webcast will be archived on the Investor Relations section of the Company’s website.
Investor Relations Contact
Westwicke Partners on behalf of Apyx Medical Corporation
Mike Piccinino, CFA
investor.relations@apyxmedical.com
About Apyx Medical Corporation
Apyx Medical Corporation (formerly Bovie® Medical Corporation) is an advanced energy technology company with a passion for elevating people’s lives through innovative products in the cosmetic and surgical markets. Known for its innovative Helium Plasma Technology, Apyx is solely focused on bringing transformative solutions to the physicians and patients it serves. The company’s Helium Plasma Technology is marketed and sold as Renuvion® in the cosmetic surgery market and J-Plasma® in the hospital surgical market. Renuvion® offers plastic surgeons, fascial plastic surgeons and cosmetic physicians a unique ability to provide controlled heat to the tissue to achieve their desired results. The J-Plasma® system allows surgeons to operate with a high level of precision and virtually eliminating unintended tissue trauma. The Company also leverages its deep expertise and decades of experience in unique waveforms through original equipment manufacturing (OEM) agreements with other medical device manufacturers. For further information about the Company and its products, please refer to the Apyx Medical Corporation website at www.ApyxMedical.com.
Cautionary Statement on Forward-Looking Statements
Certain matters discussed in this release and oral statements made from time to time by representatives of the Company may constitute forward-looking statements within the meaning of the Private Securities Litigation Reform Act of 1995 and the Federal securities laws. Although the Company believes that the expectations reflected in such forward-looking statements are based upon reasonable assumptions, it can give no assurance that its expectations will be achieved.
Forward-looking information is subject to certain risks, trends and uncertainties that could cause actual results to differ materially from those projected. Many of these factors are beyond the Company’s ability to control or predict. Important factors that may cause actual results to differ materially and that could impact the Company and the statements contained in this release can be found in the Company’s filings with the Securities and Exchange Commission including the Company’s Report on Form 10-K for the year ended December 31, 2019, which is expected to be filed by March 31, 2020. For forward-looking statements in this release, the Company claims the protection of the safe harbor for forward- looking statements contained in the Private Securities Litigation Reform Act of 1995. The Company assumes no obligation to update or supplement any forward-looking statements whether as a result of new information, future events or otherwise.
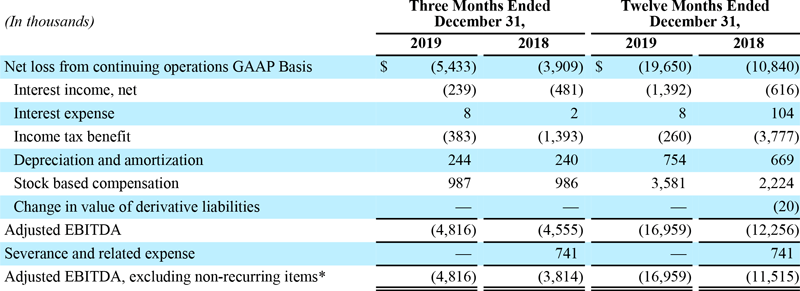
APYX MEDICAL CORPORATION
RECONCILIATION OF GAAP NET INCOME/(LOSS) RESULTS TO NON-GAAP ADJUSTED EBITDA/(LOSS)
(Unaudited) (Restated and Revised) (In thousands)
Use of Non-GAAP Financial Measures
We present these non-GAAP measures because we believe these measures are useful indicators of our operating performance. Our management uses these non-GAAP measures principally as a measure of our operating performance and believes that these measures are useful to investors because they are frequently used by analysts, investors and other interested parties to evaluate companies in our industry. We also believe that these measures are useful to our management and investors as a measure of comparative operating performance from period to period.
The Company has presented the following non-GAAP financial measures in this press release: adjusted EBITDA. The Company defines adjusted EBITDA as its reported net income/(loss) (GAAP) plus income tax expense, interest, depreciation and amortization, stock-compensation expense, and changes in value of derivative liabilities.
The following unaudited table presents a reconciliation of net loss to Adjusted EBITDA for the first quarter of fiscal year 2020. The reconciliation assumes the mid-point of the Adjusted EBITDA loss range and the midpoint of each component of the reconciliation, corresponding to guidance for GAAP net loss of $9.0 million to $8.6 million for the first quarter of fiscal year 2020.